How do you know time logged actually reflects time worked?
In many teams, time tracking relies on manual inputs or assumptions that say very little about real activity. Leaders are left guessing, workers are forced to over-explain, and trust slowly erodes.
At Kaamfu, we believe time and activity should be grounded in reality. Kaamfu Workstation Connect exists to capture real desktop activity and tie it directly to tasks, shifts, and effort inside Kaamfu—without guesswork or constant supervision.
What Kaamfu Workstation Connect is
Kaamfu Workstation Connect is Kaamfu’s desktop application for time and activity tracking. It runs alongside the Kaamfu web interface and connects actual desktop behavior to structured work data.
It acts as the source of truth for when work starts, how long it runs, what task is being worked on, and what activity occurs during that time.
Why this matters
Time tracking only works when it reflects reality. Workstation Connect ensures that effort data in Kaamfu is accurate, observable, and consistent across teams.
- Verified effort: Time is captured from real desktop activity, not memory or estimates.
- Clear accountability: Tasks, shifts, and breaks are tied directly to activity.
- Operational confidence: Leaders rely on observable signals instead of status updates.
- Transparent tracking: Workers always know what is captured and when.
How it works
Workstation Connect follows a clear, enforceable flow from mandate to daily use.
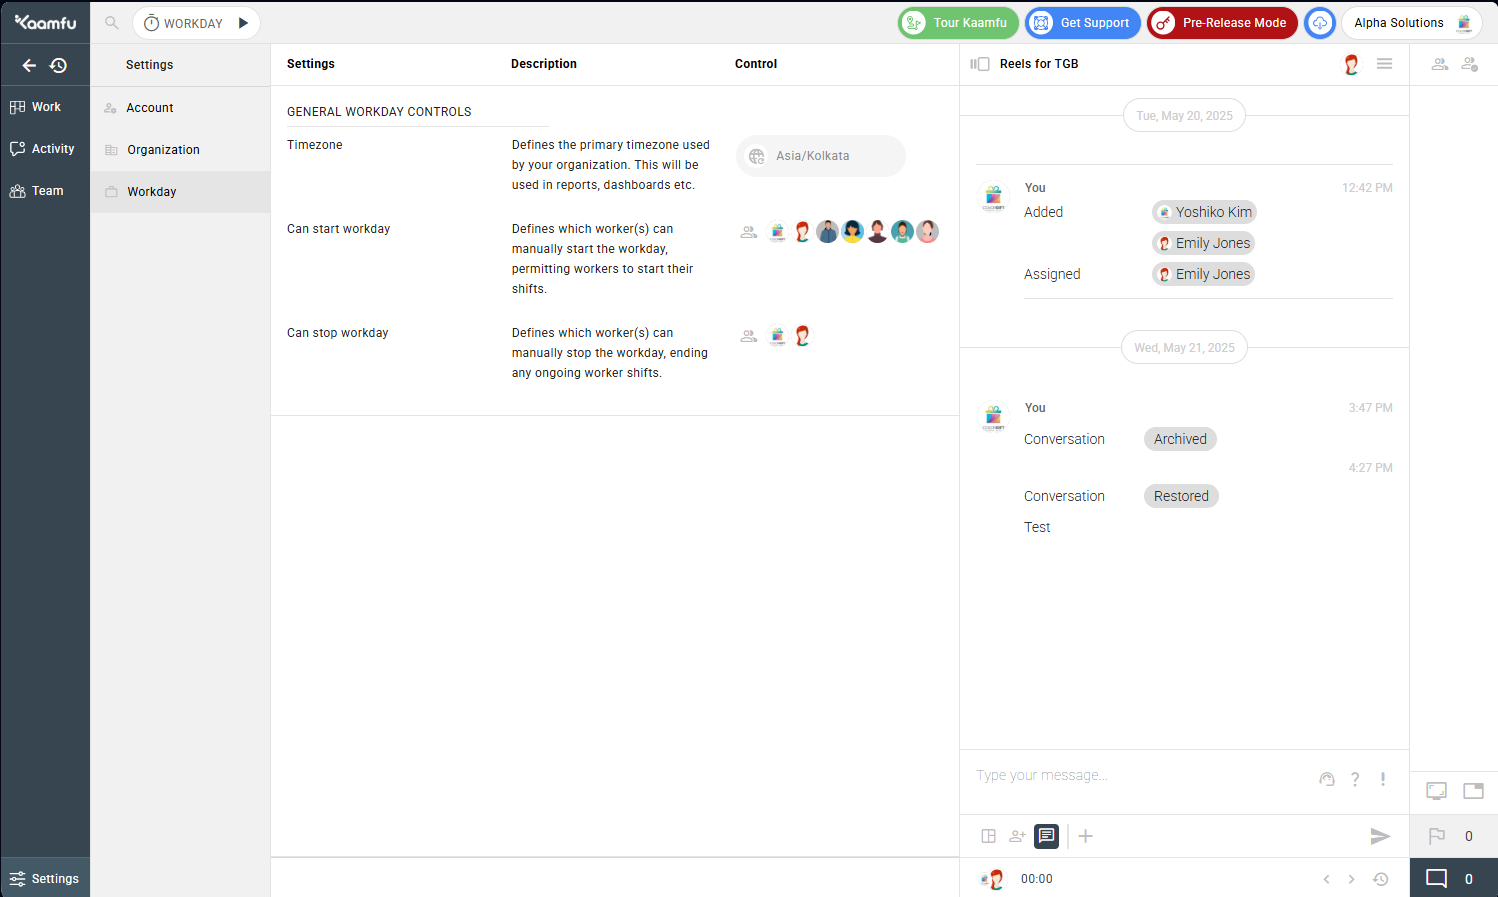
- Org owners mandate Workstation Connect for workers through the Global Directory, or during signup by selecting the mandate checkbox at the Invitation step, ensuring the requirement is active even before the invitee joins the organization.
- Mandated workers download and install Workstation Connect directly from the Kaamfu web interface.
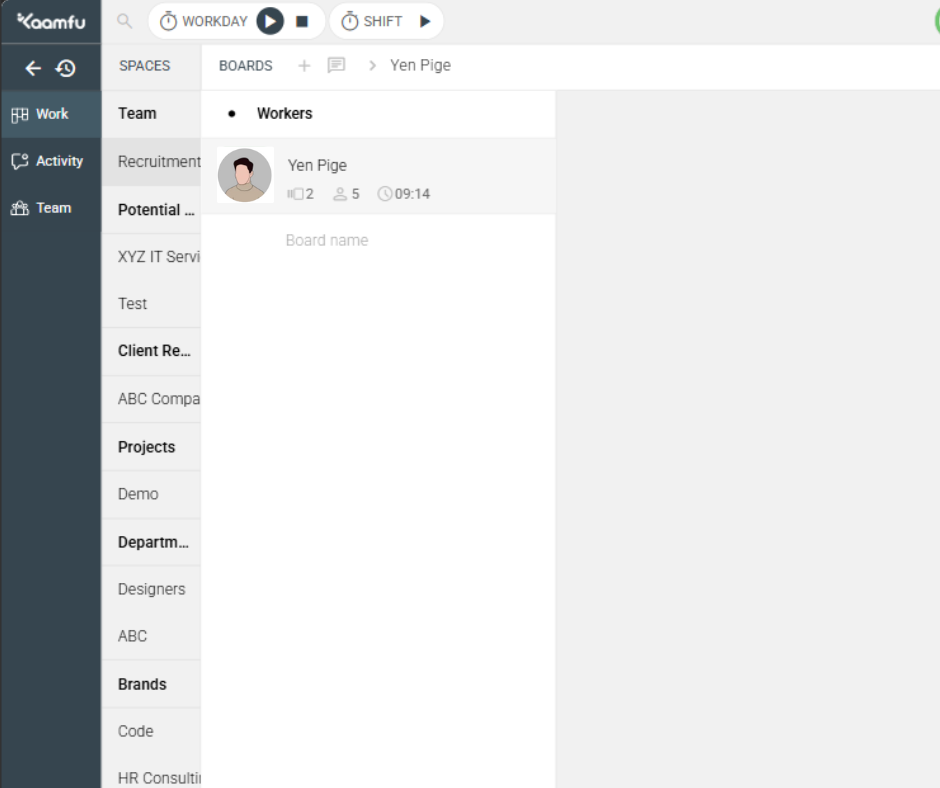
- Workers must shift in from the desktop application to begin work.
- Every time they shift in, workers review and accept the terms and conditions.
- Once shifted in, the app captures activity and continuously syncs shift time, active task, breaks, and effort with the Kaamfu web interface.
- Desktop screenshots are captured every three minutes and synced automatically with the web interface.
Desktop app layout and what workers see
Workstation Connect is designed to be transparent, so workers always understand their current work state.
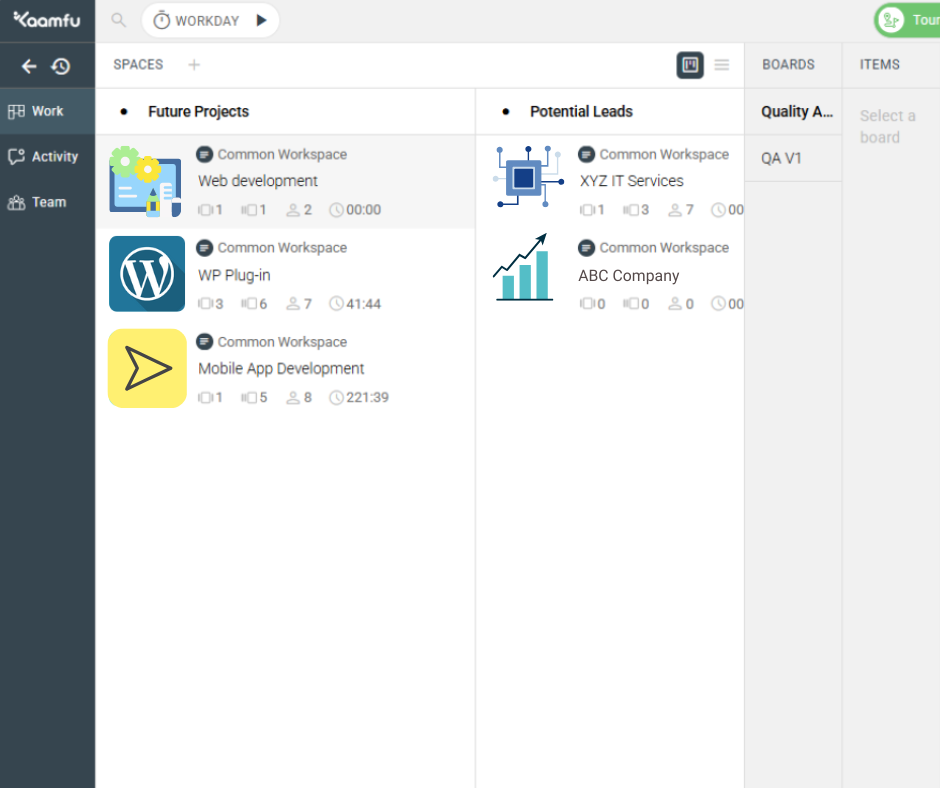
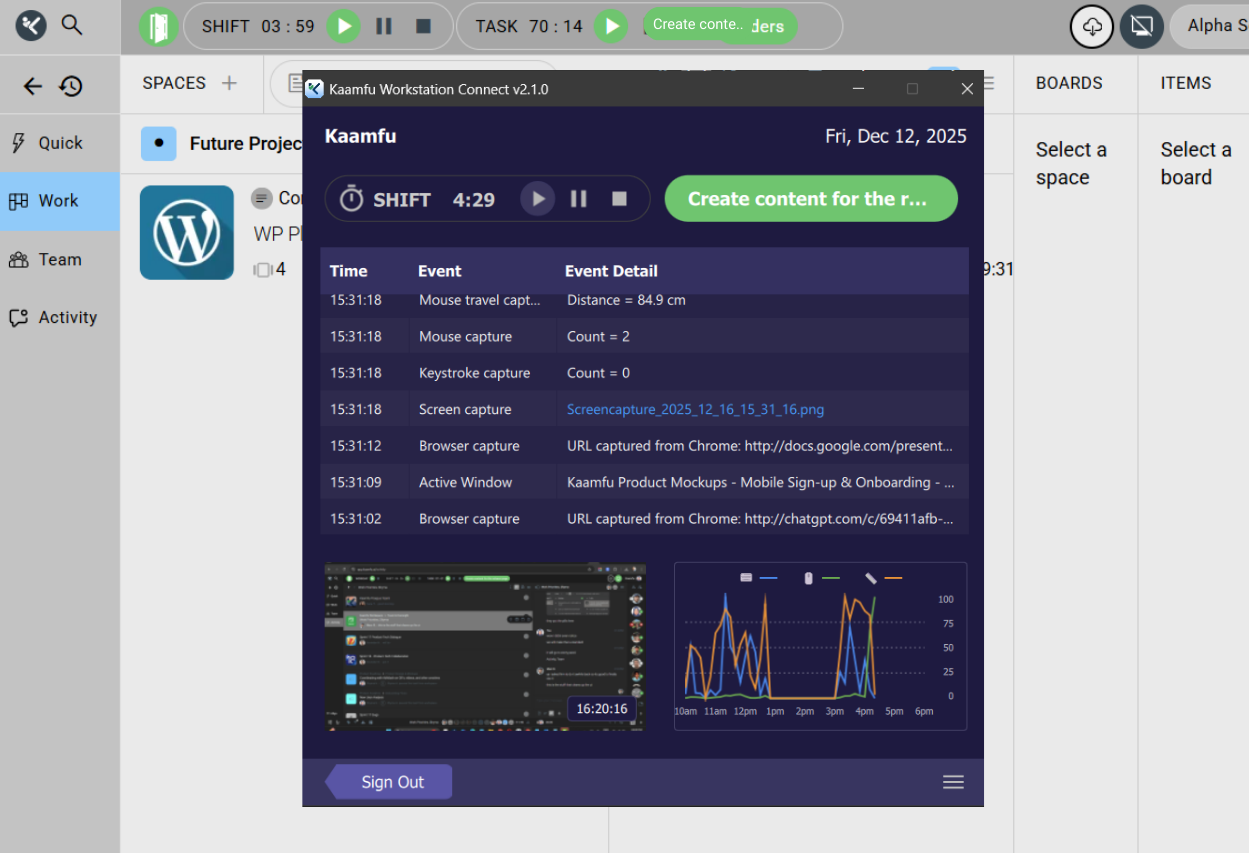
The application window shows:
- The active task name
- Total shift duration
- Shift controls to start, pause, resume, or end work
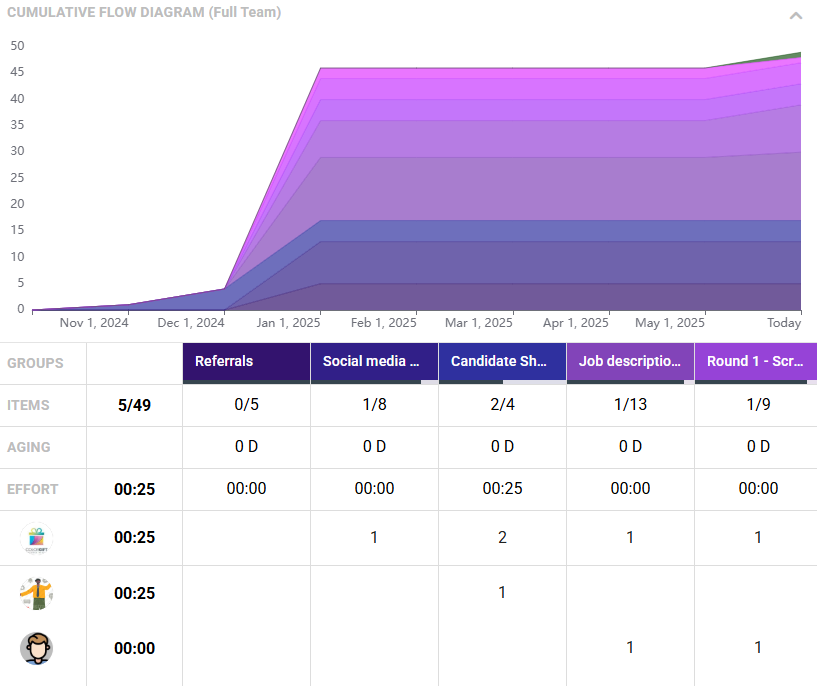
- A live activity graph across the workday
- The most recently captured desktop screenshot
- The time at which the latest screenshot was captured
Everything visible in the app reflects what is being tracked.
Activity metrics captured from the desktop
Workstation Connect captures multiple activity signals to create a complete picture of work behavior.
Captured metrics include:
- Active window changes
- Mouse movement and distance traveled
- Mouse clicks
- Keystroke counts
- Browser URL captures where applicable
When hovering over the activity graph, workers can see distance traveled, keystrokes, and mouse clicks plotted over time, providing immediate clarity on activity patterns throughout the shift.
Screenshots and work context
Screenshots are captured automatically every three minutes during active shifts.
Each screenshot is:
- Linked to the active task
- Time-stamped within the shift
- Synced with the Kaamfu web interface
- Available to authorized viewers
- Used to generate AI-powered summaries in connected views
This adds visual context to time and activity without manual reporting.
Mandating Workstation Connect for teams
Workstation Connect can be mandated only through supported enforcement points.
Mandates can be applied:
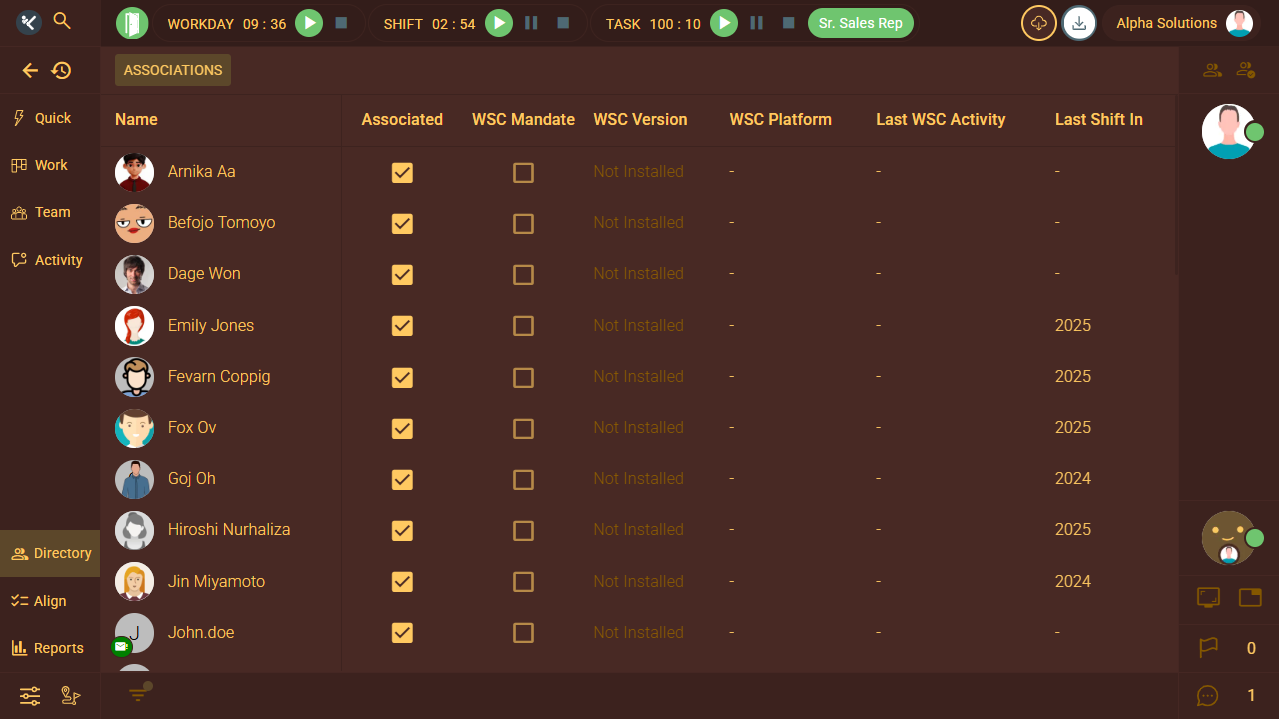
- Through the Global Directory, allowing org owners to mandate quickly across multiple workers
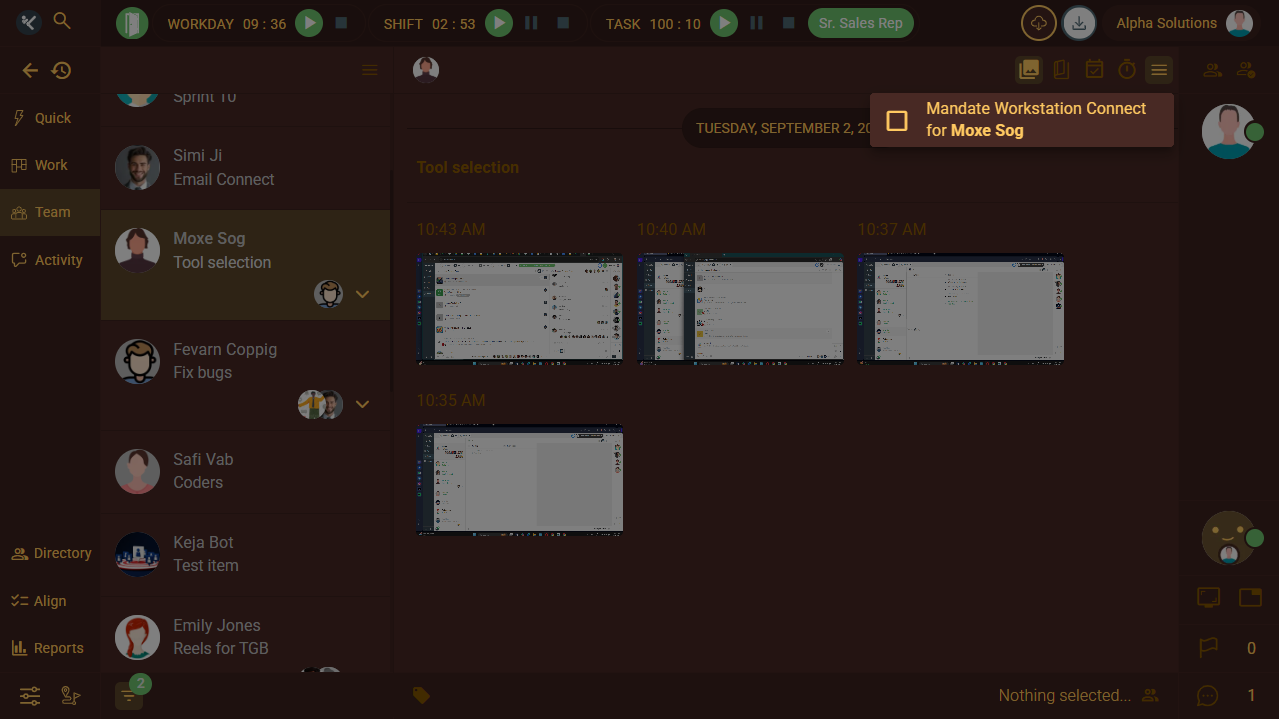
- Through the Team panel, inside the screenshots view, where mandates can be applied at the individual level
When Workstation Connect is mandated:
- Workers must shift in daily from the desktop application
- Web-only shifting is blocked
- All time, activity, and screenshots must flow through Workstation Connect
- Attempts to work without the app are prevented
This ensures consistent enforcement without follow-ups or exceptions.
Customization and compatibility
Workstation Connect supports theme changes, allowing workers to adjust the visual experience.
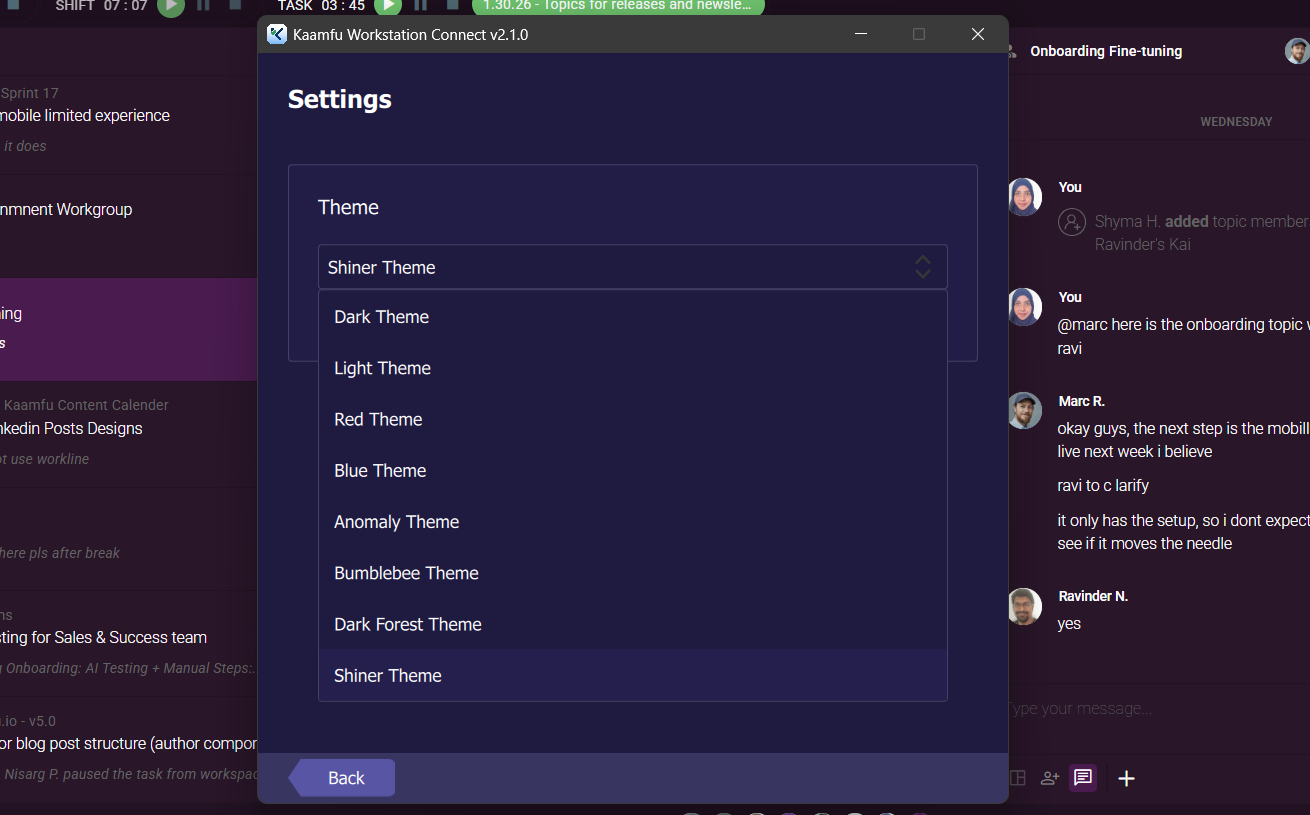
The application is compatible with supported versions of Windows, macOS, and Linux, ensuring teams can adopt it across different operating systems.
Key takeaway
Kaamfu Workstation Connect grounds time tracking in real activity. By connecting desktop behavior directly to tasks, shifts, and effort, it gives leaders reliable data and gives teams a system they can trust.