Export PDF
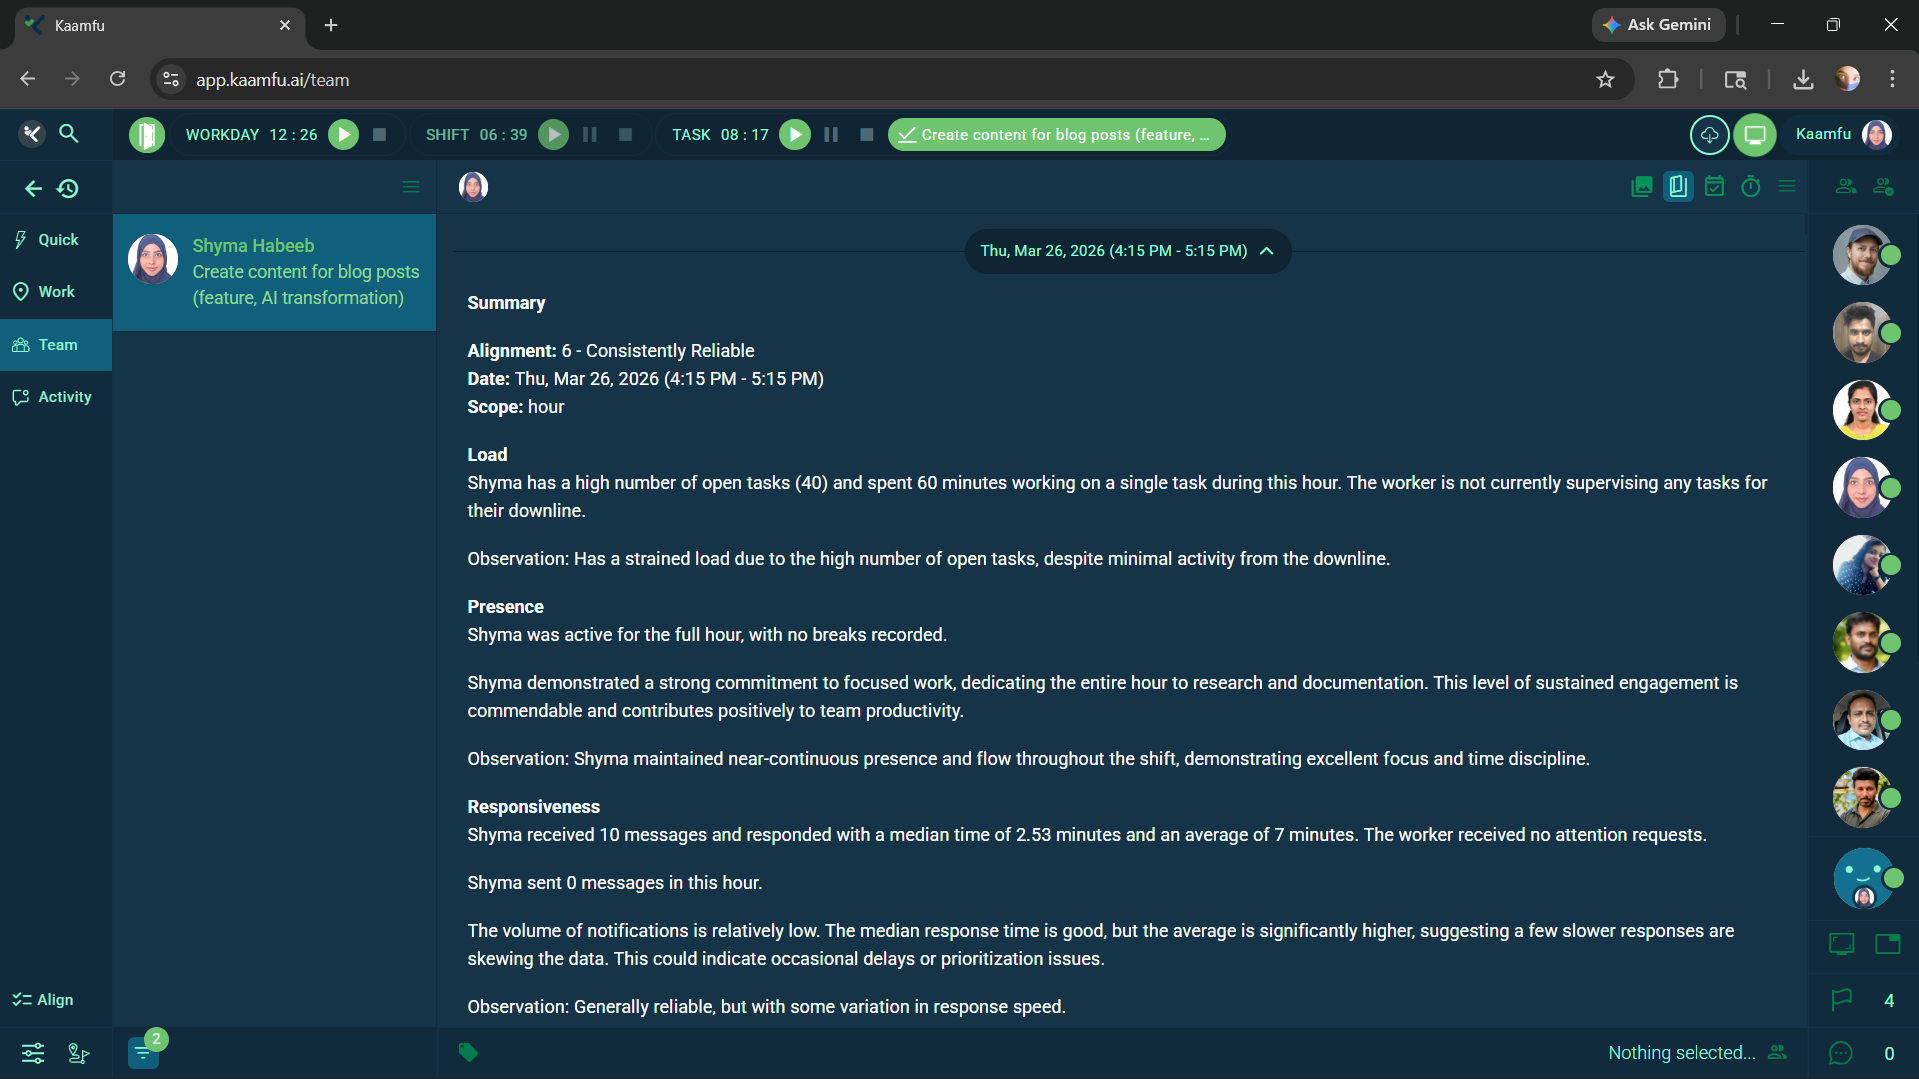
SUMMARY
The information layer between a manager and their team is built almost entirely on self-report. Status updates, check-ins, and one-on-ones all share the same structural limitation: they deliver what people chose to communicate, shaped by the moment and the relationship. This is one of the less visible reasons ai automation transformation initiatives stall: the human decision layer they are built on is producing outputs based on filtered, incomplete information. Kaamfu’s AI-powered Performance Story addresses that directly, synthesizing observed data on load, presence, responsiveness, and work activity into a readable narrative at hourly, daily, weekly, and monthly scopes. It gives managers a picture built from what the system recorded.
Management decisions about workload, support, and delegation depend on an accurate picture of each team member’s real state. The tools available give managers no reliable way to form that picture. The inputs available, status updates, check-ins, and direct observation, all share the same flaw: they reflect what a person chose to communicate, filtered through how they wanted to be perceived, and captured at a single moment in time.
Kaamfu’s AI-powered Performance Story takes a different approach. It observes worker behavior across four dimensions, synthesizes that data into a readable narrative, and delivers it at whatever time scope the management question requires. The picture it produces is what the system recorded.
Why Managers Are Working With the Wrong Information
A status update is a communication act. When a team member writes one, they decide what to include, how to frame it, and what to leave out. Those decisions are shaped by the relationship with their manager, how much time they have, and what they think is expected. Even a well-intentioned update is a curated version of reality. It tells a manager what the person decided to share, which is a fundamentally different thing from what actually happened.
The consequences are well documented. Microsoft’s 2022 Work Trend Index found that 87% of employees report they are productive at work, while only 12% of leaders say they are fully confident their teams are performing. Microsoft named this the productivity paranoia gap. By 2025, the same research showed the gap had not closed: 53% of leaders say productivity must increase, while 80% of the global workforce reports lacking the time or energy to meet that expectation. The gap exists because the information managers rely on is structurally unreliable, and no amount of more frequent check-ins fixes a method that produces filtered outputs by design.
A person who is overloaded but coping may not surface that in a check-in. A person whose responsiveness has been declining due to competing demands may not register it themselves. A person whose daily presence has become fragmented has no ready language for describing that pattern. These are exactly the signals that matter for accurate management decisions, and they are exactly the signals that conventional inputs do not carry.
What the Performance Story Shows and How to Read It
The Performance Story is generated entirely from system-observed behavior. It watches what happens and synthesizes it across four dimensions into a narrative a manager can read in under two minutes.
- Load – Open task volume relative to effort clocked and tasks completed. Flags whether a worker’s task load is being absorbed or accumulating, and whether there is a delegation gap.
- Presence – Active time and break patterns. The availability signal a manager would have working alongside the person, and has largely lost in distributed teams.
- Responsiveness – Notification volume, median and average response times, and attention requests handled. The gap between median and average is a particularly useful signal, as a wide gap points to intermittent delays that a median alone would mask.
- Task and workstation activity – What was worked on, in which spaces and boards, during each time block. The narrative layer that confirms whether effort is going to the right areas.
Each story includes an alignment score that synthesizes these dimensions into a single orientation indicator, from low to high performer. A manager reads the score for a quick read and the narrative beneath it for the reasoning. Here is what that looks like in practice:
The Performance Story for a team member over a full day, showing load observation, presence pattern, responsiveness data, and hour-by-hour task activity across spaces and boards.
Hourly, Daily, Weekly, Monthly: How Time Scope Changes What You See
The time scope of the Performance Story is variable because different management questions need different time horizons. The hourly story answers availability questions in the moment. The daily story surfaces patterns that a single hour obscures, how effort distributed across the day, whether breaks fragmented focus, whether task activity aligned to the right areas. The weekly story reveals whether a high load reading is a temporary spike or a sustained condition. The monthly story adds the longest arc: contribution trends, responsiveness patterns over time, and the persistent signals that require a structural response rather than a one-off conversation.
All four scopes are available from the Stories pane inside the Team Panel. A manager can also reach the story by right-clicking a team member’s avatar in the workline, status panel, or chat and selecting the Stories icon. The picture is always current and always as granular as the question requires.
How Accurate Management Information Connects to the Race to Autonomy
The Ragsdale Framework describes the Race to Autonomy as the progression from Stage 1 Manual Operations, where humans handle all decisions and execution, through to Stage 5 Autonomous Operations, where AI manages entire operational domains. Mid-market organizations typically operate between Stage 2 and Stage 3 today: AI provides information and humans decide, or AI recommends and humans approve. Moving forward on that progression requires one precondition: the human decision layer must be accurate before AI can responsibly take on more of the load.
An organization where managers make load and delegation decisions based on self-reported status has a work control layer producing unreliable outputs. Layering AI on top of that accelerates the same flawed decisions at greater speed. This is the distinction the Ragsdale Framework draws between automation and autonomization: automation moves the same process faster, while autonomization redesigns the conditions under which decisions are made. The Performance Story is an autonomization feature because it changes the information conditions under which a manager acts, which is a different intervention from speeding up the action itself.
Status updates are a workaround for the absence of infrastructure, and the productivity paranoia gap measures exactly what that costs. The Performance Story belongs to a different category: a tool that observes, synthesizes, and delivers a picture of each team member’s real operational state across whatever time scope the decision requires.
As organizations move further along the Race to Autonomy and AI takes on more of the routine decision layer, the accuracy of the human management layer becomes the factor that determines how far and how fast they can progress. Kaamfu is built on that premise. The Performance Story is the part of the platform that keeps every management decision grounded in what actually happened.